

cTrader Auto Support and Resistance - User Guide
The cTrader Auto Support and Resistance Indicator detects key levels using Fibonacci analysis and provides real-time alerts for trading opportunities.

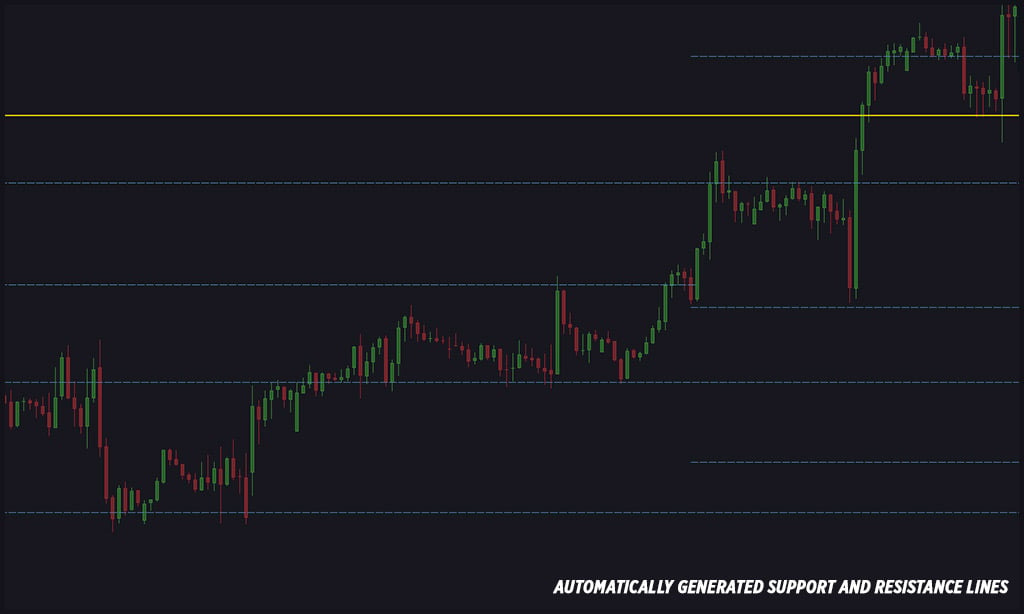
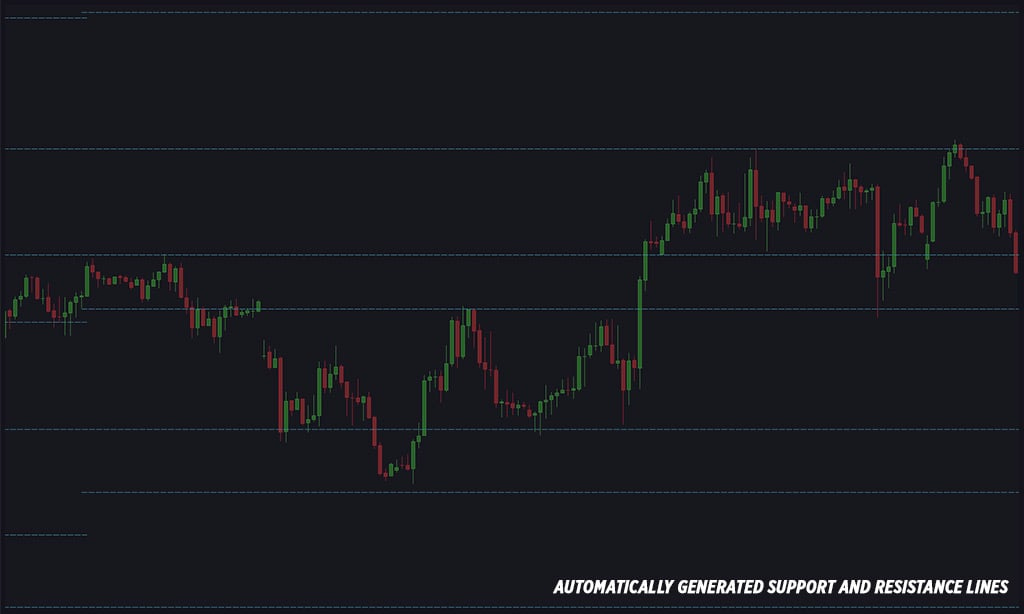
This cTrader indicator automatically draws support and resistance lines on your chart, making it easy to use for both beginners and professionals. The lines are generated based on key Fibonacci levels and price swings (zigzags).
Features:
Automatically detects and draws support and resistance lines.
Fully customizable line styles, thickness, and colors.
Adjustable number of support and resistance lines.
Alerts when price interacts with support or resistance lines.
Multiple alert options: Telegram, Email, Pop-ups, and sounds.
Ability to choose which Fibonacci levels generate the lines.
Option to trigger alerts from Ask or Bid price lines.
Configurable alert conditions: bar-close alerts or instant price-touch alerts.
Customizable alert messages with user-defined comments.
Option to enable alerts only for strong support and resistance levels.
Ability to capture and send chart screenshots via Telegram (chart must be visible).
Simple email alert setup.
Quick access to the user guide through a small button on the chart.
Parameters
Pause & Help
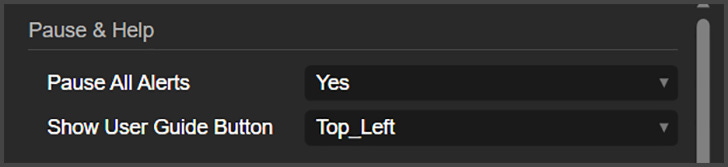
Pause All Alerts: Here, you can pause all alerts from this indicator.
Show User Guide Button: This will place a small button on the chart, that will open this user guide when clicked.
Levels
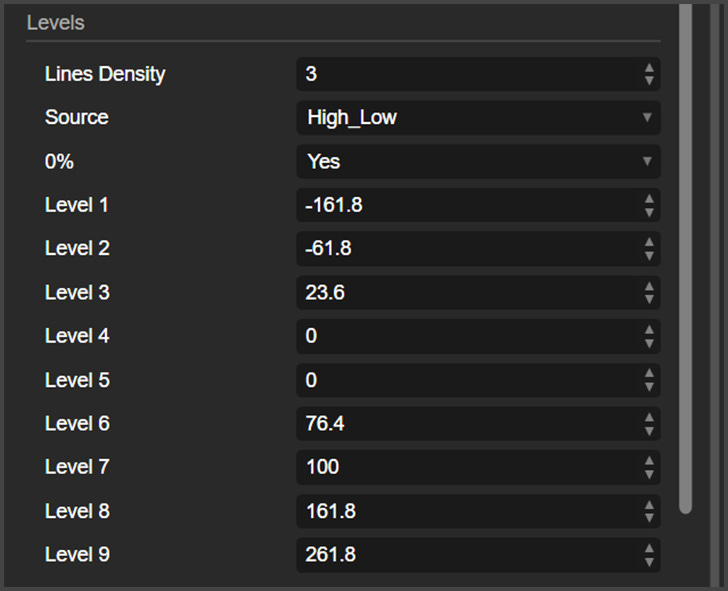
Lines Density: Here, you can control how many lines this indicator will generate on the chart.
Source: Here, you can choose if you want the indicator to consider the bar wick when creating the support and resistance levels or not.
0%: This is how you enable the 0% Fibonacci level to be generated on the chart.
Levels 1 to 9: These are the Fibonacci levels being used to create the support and resistance levels. To disable a level, just write “0” (zero).
Customization
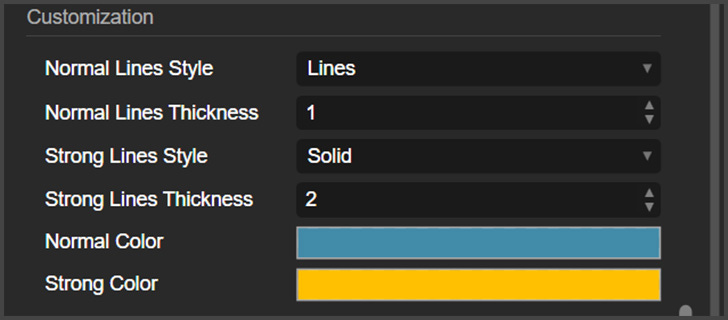
This indicator uses a zigzag line (not visible) to detect the market movements. Normal lines are generated from normal size movements, and strong lines are generated from bigger movements. The customization group is where you can customize the appearance of these lines.
Alerts
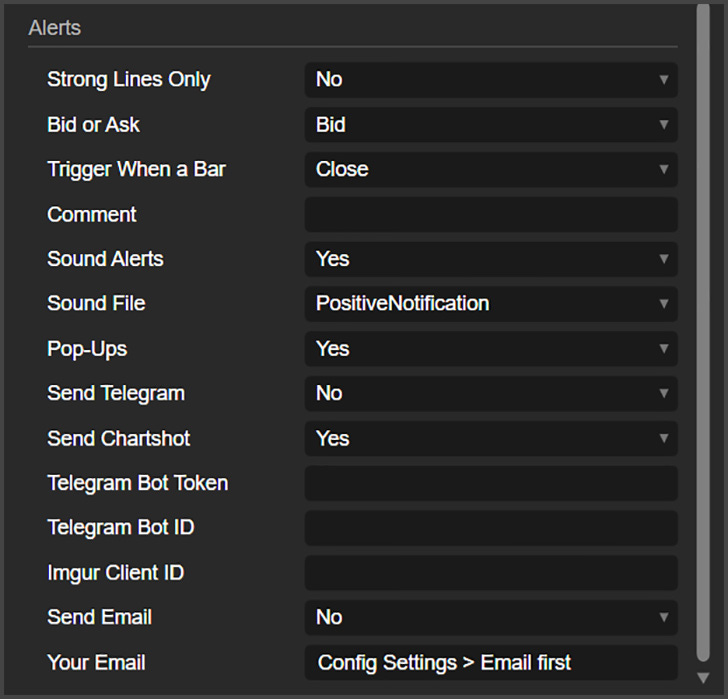
Strong Lines Only: If you want alerts for the strong lines only, here is where you enable that.
Bid or Ask: Here, you can choose if you want the alerts to be triggered by the bid or ask price level.
Trigger When a Bar: This indicator can alert you immediately when the price interacts with the levels, or when a bar closes touching a level.
Comment: Here you can write a comment that will show up on the pop-ups, Telegram messages and email alerts.
Sound Alerts: Here, you can choose if you want to receive sound alerts on cTrader.
Sound File: This is the sound used for the sound alerts.
Pop-Ups: Here, you can enable cTrader pop-up alerts.
Send Telegram: This is where you can enable Telegram Alerts.
Send Chartshot: A chartshot is a screenshot of the chart, and here is where you can enable that.
Telegram Bot Token and ID: Place your Telegram bot credentials here.
Imgur Client ID: This indicator uses Imgur to send chartshots to Telegram. Put here your Imgur client ID.
Send Email: Here, you can enable email alerts.
Your Email: This is the email you want to send alerts to.