

cTrader Fibonacci Bands Indicator - User Guide
Unlock Precision Trading with Customizable Fibonacci Bands and Smart Alerts

If you're looking for a dynamic Fibonacci channel indicator for cTrader, look no further. This indicator automatically draws Fibonacci bands parallel to a moving average of your choice. It's user-friendly and, like my other indicators, provides alerts through Pop-up, Sound, Email, and Telegram messages. Plus, you have the flexibility to customize the Bands, Fibonacci levels, and Alerts.
Here's a list of its features:
Fibonacci Bands Calculation: The indicator calculates and plots Fibonacci bands based on your selected moving average. These bands stem from Fibonacci levels (e.g., 0.0%, 38.2%, 61.8%, or any others) and extend above and below the moving average by a specified factor.
Moving Average Configuration: Customize the moving average type (e.g., Simple, Exponential, etc.) and the number of periods used in the calculation. The moving average serves as the foundation for the Fibonacci bands.
Alert Functionality: The indicator offers various alert options to notify traders about specific events. This includes price level touch alerts and proximity alerts.
Price Level Touch Alerts: Configure the indicator to trigger alerts when the price touches specific Fibonacci levels. Alerts can be based on the closing price or immediately when the price touches the level.
Proximity Alerts: Set up proximity alerts to receive notifications when the price approaches or moves away from a specified Fibonacci level within a defined distance. Alerts can trigger when the price is approaching or distancing from the level.
Alert Output Options: Choose from sound alerts, pop-ups, Telegram messages, and email notifications for alerts. Sound alerts can be customized by selecting different sound files.
Visualization Options: Customize the visualization of Fibonacci levels with options such as displaying percentage values, setting color for percentage labels, controlling label location on the chart, enabling/disabling specific bands, and choosing color, thickness, and appearance of the bands.
Configurable Fibonacci Levels: Tailor the indicator to your trading strategy by adjusting the specific Fibonacci levels used in the calculation. Positive and negative Fibonacci levels can be customized individually.
In summary, the VegaXLR - Fibonacci Bands indicator combines Fibonacci analysis and moving averages to help identify potential support and resistance levels. With configurable alert functionality and visualization options, it's an invaluable tool for traders who rely on Fibonacci retracements or expansions.
Video and Screenshot
Parameters
Play/Pause Alerts & Help
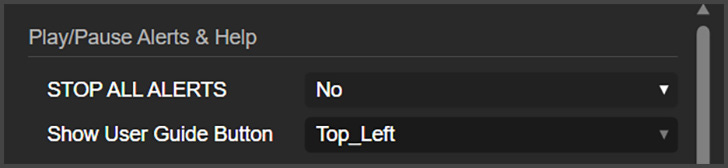
Stop All Alerts: Here you can stop all alerts this indicator can generate. Useful when you don’t need any more alerts or when you want to reconfigure the parameters of this indicator
Show User Guide Button: This will enable a small button on the chart, that when clicked will open this user guide to help you.
Alerts
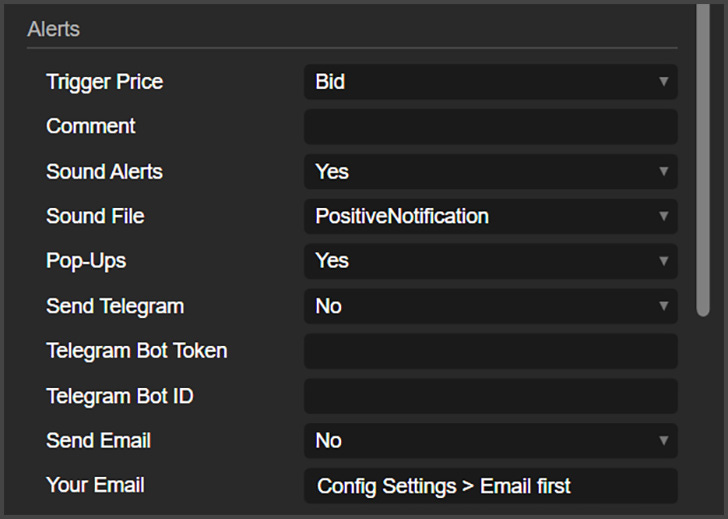
Trigger Price: Choose if you want the alerts to be triggered by the Bid or the Ask price.
Comment: Write here a comment that will be shown on the alert window and on the Telegram messages. Useful when you want to make a note to remember what to do when the alert is triggered.
Sound Alerts: Choose if you want to receive sound alerts or not.
Sound File: Choose the sound type for the sound alerts.
Pop-Ups: Here you can enable or disable cTrader Pop-up alerts.
Send Telegram: Enable or disable Telegram alerts
Telegram Bot Token and Bot ID: Place here the credentials of your Telegram bot.
Send Email: Enable or disable email alerts.
Your Email: Write here the email address where you want to receive the alerts.
Proximity Alerts
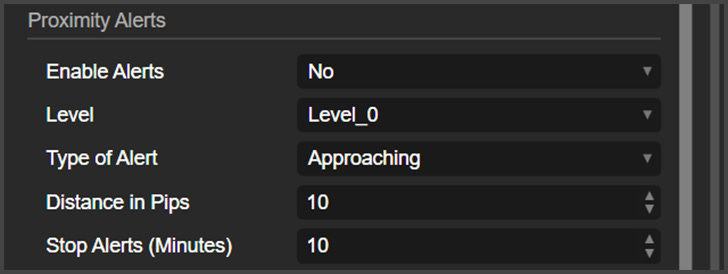
Enable Alerts: Here you can enable the proximity type alerts. These alerts will trigger when the price is approaching or distancing from a determined level chosen by you on the next parameter.
Level: Choose the level you want the alerts for.
Type of Alert: Choose if you want approaching alerts or distancing alerts.
Stop Alerts (Minutes): Here you can set an amount in minutes that the proximity alerts will be disabled after the last alert of this kind. By default, the proximity alerts will be disabled for 10 minutes after you receive an alert of this type.
Level Touch Alerts
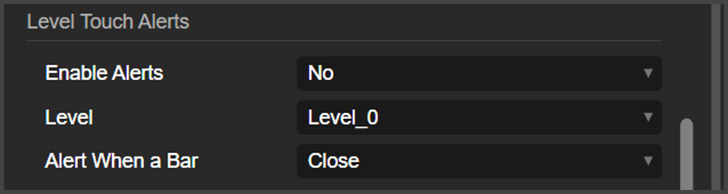
Enable Alerts: Enable alerts for when the price touches the Fibonacci levels.
Level: The level you want the alerts for.
Alert When a Bar: Choose if you want the alerts to be triggered when a bar closes touching a level, or immediately when the price touches the level.
Bands
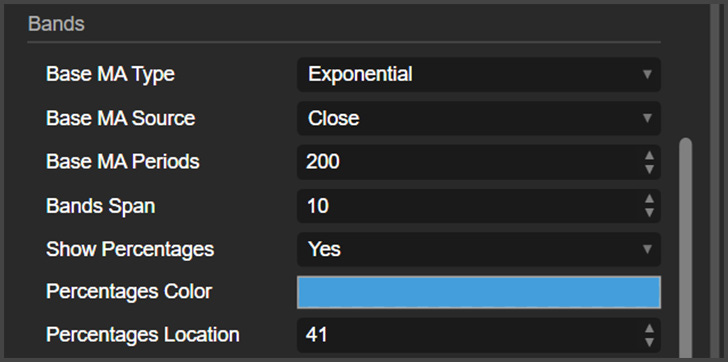
Base MA Type: Here you choose the base moving average type. This is where all the bands originates from.
Base MA Source: Choose the source for the base moving average.
Base MA Periods: Choose the periods for the base moving average.
Bands Span: This is a multiplier that will analyze the average size of the bars, and then use that to apply the distances from one band to another. I recommend leaving this on 10.
Show Percentages: Here you can enable or disable the percentage labels for the bands on the chart.
Percentages Color: Here you can change the color for the percentage labels.
Percentages Location: Choose the position of the percentage labels. 41 means that the labels will be places 41 bars behind the current bar.
Positive Fibonacci Levels
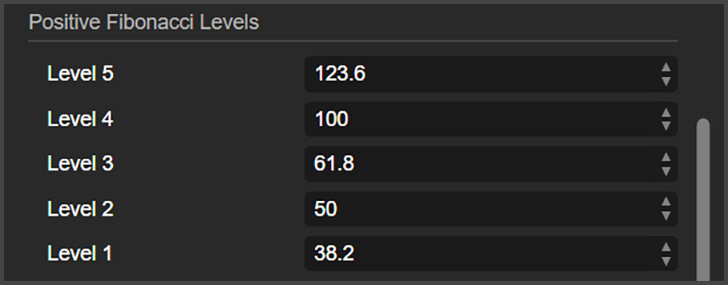
Here you can configure the Fibonacci levels that will be plotted above the 0% line (The base moving average)
Negative Fibonacci Levels
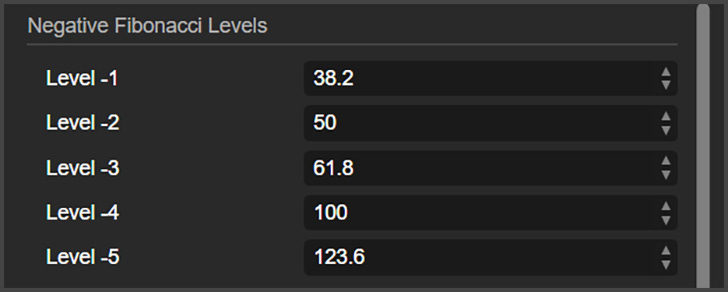
Here you can configure the Fibonacci levels that will be plotted below the 0% line (The base moving average)
Lines
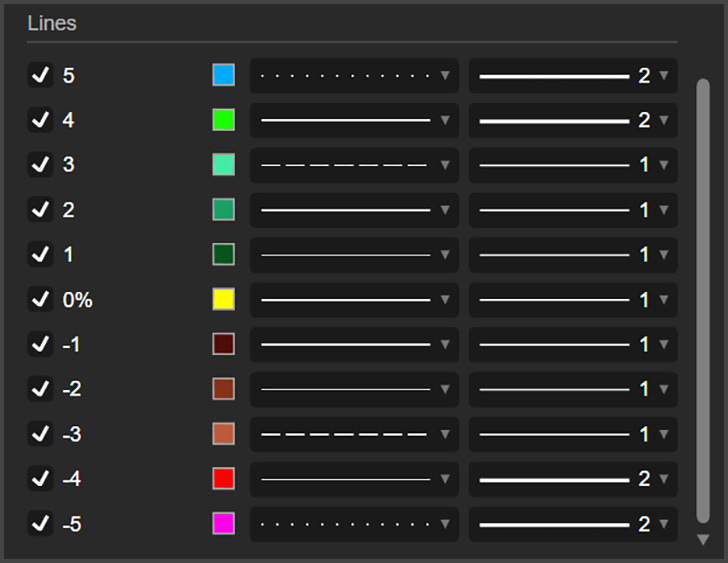
Here you can customize the Fibonacci bands on the chart. As you can see, you can enable/disable them, change the colors, change the thickness, and change the style of the lines.